1. Tornadoes:
Tornadoes can form in large thunderstorms in regions where powerful vertical wind shear occurs. Some basic requirements is that the cold outflow of air from downdrafts does not undercut the updraft. The strong vertical wind shear helps to create horizontal spin, which upon being lifted up can begin to rotate. A strongly rotating and long lasting thunderstorm can lead to the formation of a tornado. Tornadoes can grow quite large and when that rotating air column exceeds 5 - 10 km diameter it is clued a mesocyclone indicating the scale of the tornado is large enough to fit in the mesoscale criteria.
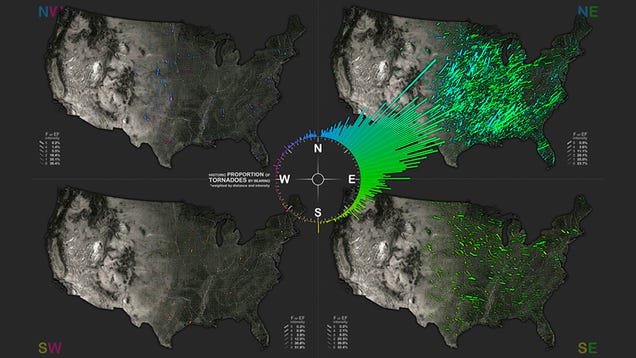
The reasons this is the dominant direction in the US is determined by two main factors. First the majority of tornadoes are formed east of the Rocky Mountains as depicted and pretty well explained by the chart below. The other main reason is that the predominant winds in the Northern Hemisphere are Westerlies thus driving the tornadoes to the east.
Tornadoes happen in most countries and certainly occur in China I was only able to find information on one tornado in Guizhou Province in 1995, which may have been responsible for 37 deaths.
However this document indicated a need for a citation so it wasn't really good proof.
Guizhou Province is found in the southeaster interior of the country. So while the U.S. has approximately 1200 tornadoes a year I could not find a single substantiated tornado in China.
However, the chart below indicates that tornadoes have occurred, albeit infrequently in southeastern China.

From: http://www.windows2universe.org/earth/Atmosphere/tornado/agri_map.html
Based on the graph below Tornado Occurrences appear to have increased over time, however, the most likely reason these figures may not be accurate are based on two factors. First documentation of historical events requires both the initial recording of the event and substantiation. The dates of the graph stretch from the early 1950's well before the advent of the internet and cell phones, which have made recordings of events much easier to document. The other factor may be that for a tornado to be documented requires that it be sited and the opportunity for that requires that more people occupy more of the land to witness it.
On the other hand the number of Tornadoes over the years could have increased in recent years for many reasons including but the main ones stemming from severe weather events that have seen increased temperatures colliding with cold temperatures, in the case of the U.S. the rise does seem dramatic.
Based on the graph below Tornado Occurrences appear to have increased over time, however, the most likely reason these figures may not be accurate are based on two factors. First documentation of historical events requires both the initial recording of the event and substantiation. The dates of the graph stretch from the early 1950's well before the advent of the internet and cell phones, which have made recordings of events much easier to document. The other factor may be that for a tornado to be documented requires that it be sited and the opportunity for that requires that more people occupy more of the land to witness it.

On the other hand the number of Tornadoes over the years could have increased in recent years for many reasons including but the main ones stemming from severe weather events that have seen increased temperatures colliding with cold temperatures, in the case of the U.S. the rise does seem dramatic.
2. Hurricanes:
The three main requirements for hurricane to form are usually over tropical waters where the winds are light and water temperature is warm typically over 80 degrees F, and the humidity is high extending up through the troposphere. As China is such a large country which lies as far south as 20 degrees South Latitude, with borders to the Pacific Ocean,which can be quiet warm it is vulnerable to hurricane activity. However, in China the term Typhoon is used instead of Hurricane. The term Typhoon originates from the Cantonese world "Tai Feng"
From: http://factsanddetails.com/china/cat10/sub64/item398.html
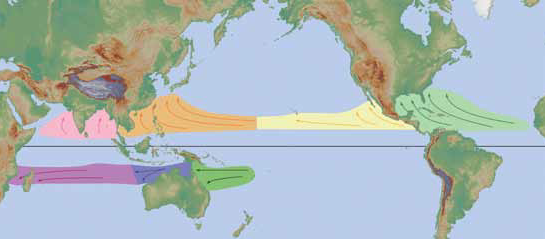
For the most part typhoons first affect the Philippine and Japanese Islands where they are often broken up so the damage to mainland China is not as substantial. As typhoons are the appropriate term for Pacific Ocean generated hurricanes it will be used as a synonym for hurricane when spoken of in the future. Other regions where hurricanes form include the Caribbean and in the Indian Ocean where hurricanes or typhoons are known as tropical cyclones. See the map below for a visual depiction of these terms.
The three main requirements for hurricane to form are usually over tropical waters where the winds are light and water temperature is warm typically over 80 degrees F, and the humidity is high extending up through the troposphere. As China is such a large country which lies as far south as 20 degrees South Latitude, with borders to the Pacific Ocean,which can be quiet warm it is vulnerable to hurricane activity. However, in China the term Typhoon is used instead of Hurricane. The term Typhoon originates from the Cantonese world "Tai Feng"
From: http://factsanddetails.com/china/cat10/sub64/item398.html
For the most part typhoons first affect the Philippine and Japanese Islands where they are often broken up so the damage to mainland China is not as substantial. As typhoons are the appropriate term for Pacific Ocean generated hurricanes it will be used as a synonym for hurricane when spoken of in the future. Other regions where hurricanes form include the Caribbean and in the Indian Ocean where hurricanes or typhoons are known as tropical cyclones. See the map below for a visual depiction of these terms.
Although similar the below map better indicates where hurricane, typhoon and tropical cyclones occur
In the Unites States hurricanes generally form in the Caribbean Sea and then travel to the northwest till they approach the larger Continental U.S. land mass. Upon reaching the higher latitudes the Westerlies play a large part in pushing those storms back to the east so they will travel to northern Europe. Those that encroach onto the U.S. mainland typically break up due to the friction with land and those that turn early and head back out to the Atlantic Ocean are soon broke up due to the much cooler ocean temperatures.
China experiences Typhoons which are the equivalent of hurricanes. Compared to the U.S. that has on average 12 Tropical Storms or Hurricanes annually (See image below). China on the other hand experiences Typhoons less frequently based on website searches approximately 1 per annum is typical.
From: http://factsanddetails.com/china/cat10/sub64/item398.html


